You’ve seen the phrase so many times you probably don’t notice it anymore: “95 times out of 100, the error due to sampling would fall within this range.” That phrase is actually crucial for any consumer of polling data and any researcher, as a warning and an underpinning of the science of polling.
Humility
Humility is important in any profession – and in any relationship – but “95 times out of 100” is a constant reminder that polls are imperfect, because the flip side is that we should expect one in every 20 polls to fall outside the margin of error. Especially for campaign pollsters, we celebrate the times when we “nailed the final result.” In the years after Karen Handel’s 2017 special election win in Georgia’s Sixth Congressional District, I mentioned our final survey margin of four points enough times in the NRCC pollster summits to all but bait a typically mild-mannered pollster to say, “Just shut the hell up about that race.”
While we may be proud when we get it exactly right, we have to acknowledge that the math behind random sampling means that are likely to be off by a least a small amount, and one out of 20 times we should expect to be off by more than the margin or error. I have to take that statistical possibility of being outside the margin into account every time I fire up SPSS and run commands for a dataset. Every data morning we’re thinking about whether we’ll need to weight the data to align with our quotas, but the first practical step is to ask, “Are the fundamentals of this poll solid enough that we can proceed, or is this one of the polls outside the margin?”
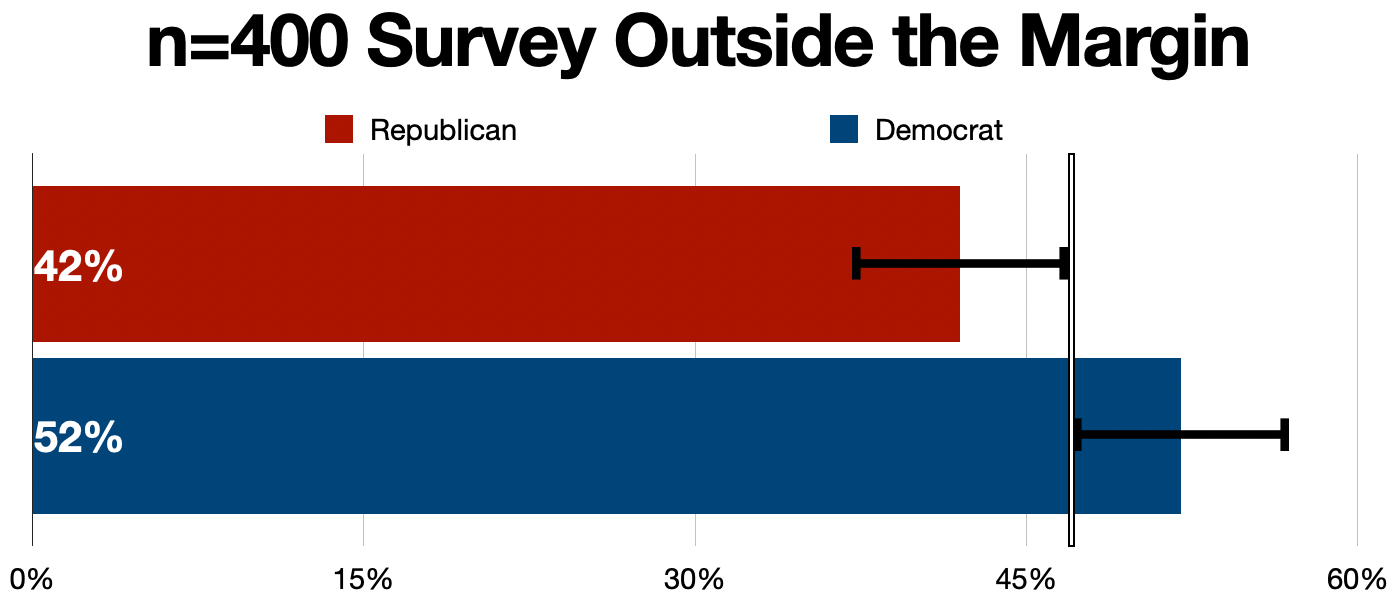
Technically, a survey could be an outlying result but be close enough that you don’t know for sure. Suppose you could know that the actual current standing of a congressional race had the Republican at 46 and the Democrat at 44, with 10 percent undecided. If your survey of 400 respondents – with a margin of error of ±4.9 percent – comes back showing the Democrat at 48 percent and the Republican at 42 percent, you’re within the margin of error for both numbers (but barely). A result showing the Democrat ahead by 49 to 41 percent would be outside the margin.
Of course, we don’t know the actual number when we’re in the field, so we can’t say for sure that one is within the margin of error and the other is not, which is another argument for humility on the part of the pollster. We’ve had one poll that was a clear enough miss that we had to spike it and we redid the survey on our dime. The worst part was that it was in the fall and costs were split between the campaign and the congressional committee. In the data we spiked, our client was down 14; in reality, our client was still behind, but by a margin closer to the six points the re-fielded survey indicated.
The Margin of Error
The margin of error you see around surveys using a probability sample is typically a straightforward calculation. That straightforward calculation yields the following numbers:
There are a couple of things to keep in mind with this chart. The first is that these statistics do not apply to non-probability sampling. For example, if you’re looking at a panel survey that was not compiled through a probability method (starting with mailing invitations to an address-based sample, for example, or with telephone calls to a random-digit-dial sample) the math of a margin of error calculation doesn’t apply. You might see a “confidence interval”, which will mirror the margin of error, but that number should be understood to be “what the margin of error would be for a sample this size if we’d used a probability sample.” That doesn’t necessarily mean the data is bad; in fact that language likely means it’s coming from a pollster who understands the limitations of non-probability sample and is handling it well.
Second, your eye might be drawn to the relatively small changes in the margin of error between 600 and 800 respondents, or between 800 and 1000 respondents. If you’re paying for polling, you might ask, “Why would we pay for a 1000 sample?” The answer is sometimes, “Because we’re planning to release the results and the press expects it,” but the strategic answer is, “So we can have more confidence in our subgroups.” The 1000 sample for a national survey is going to give us better numbers by region or party than the 800 sample as we’re looking at figures over 300 respondents rather than closer to 250.
A Pet Peeve
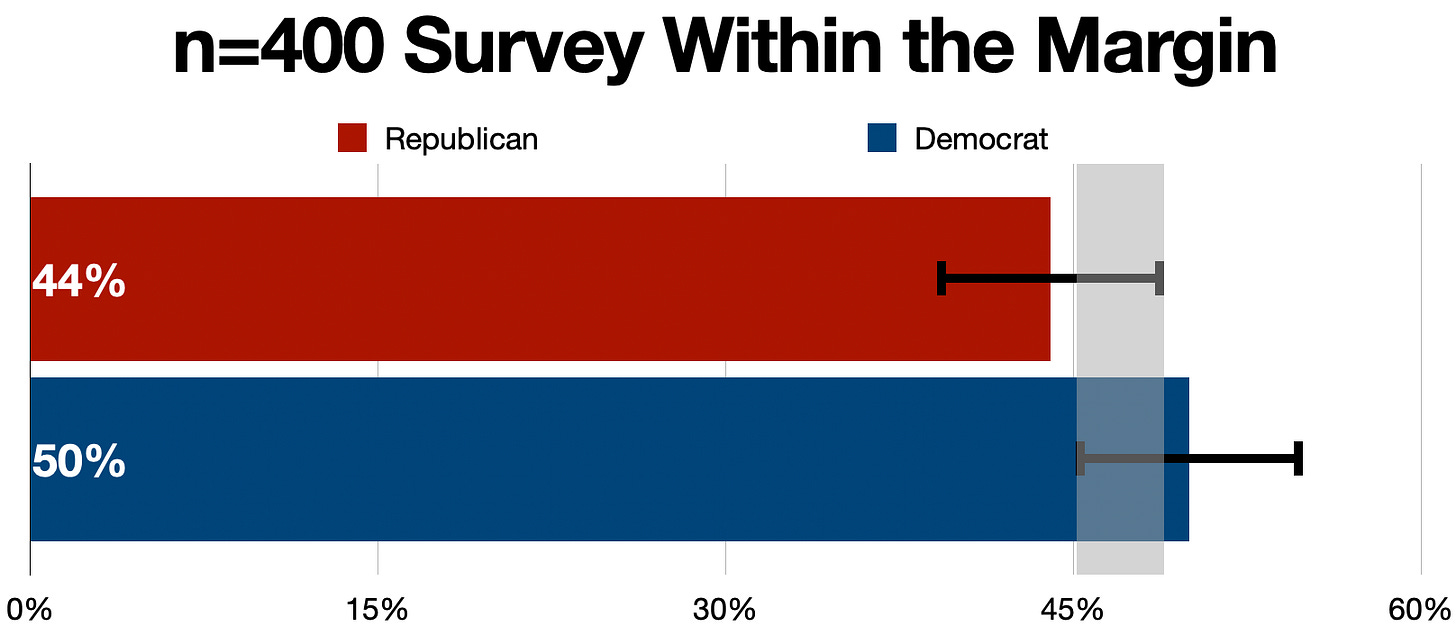
The discussion of the margin of error brings me to a pet peeve: media reports saying a race is outside the margin of error because the margin in the survey is wider than the absolute value of the statistic. In the case of a 400-respondent sample in a congressional race, a six-point lead might get reported as “outside the margin of error,” but it isn’t. The margin applies to the percentage for both candidates, in either direction (which is why we say, “plus-or-minus 4.9%”), and not the gap between the two. When we apply the margin of error to both percentages, it looks like this:

The standard margin of error of ±4.9% means the Republican in this case could be as high as 48.9 percent and the Democrat could be as low as 45.1 percent. The gray bar shows the range of overlap … it’s not likely that the race is tied, or that the Republican is ahead, but statistically it could be. With a 400 sample, one of the candidates needs to be ahead by 10 points for the race to truly be outside the margin of error.

In a campaign setting where we are seeing many surveys for a single race, and can observe trends, we may have a good deal of confidence that our candidate is ahead or behind, even in a tight race. Each individual poll is a snapshot in time; over time, we see a larger picture with a sense of a larger sample size with the caveat that events and advertising do change the trajectory of the race.
All this to say: the math behind sampling is great, because it allows us to have a good idea of what is going on with the public, in an election or in views of public policy, but it also should remind us that it’s not an exact science.


The knowledge that one in 20 polls is total crap is a humility often not seen by those of us in the business but consumers of our data presume it, or more